The Most Important Metrics That Characterise Successful And Sustainable Internet Businesses


2014–15: The Wonder Years
Between 2014 and 2015 millions of Indian shoppers took a newfound shine to buying products on the Internet. Industry leader Flipkart, for example, was reported to have clocked 300–400% growth in this period. Put together, Indian online retailers sold over $8 Bn (Gross Merchandise Value) worth of products in 2015.
Things were looking good as investors poured billions of dollars of capital into these e-tailers with the expectation of 2016 sales of over $16 Bn and a market size of over $80–100 Bn by 2020. This appeared eminently achievable given that even at $100 Bn market size Internet retail would be <10% of total Indian consumption of over $1.2 Tn in 2020. There was nothing but headroom for growth.
2016: The Phantom Menace
All was not well though. A strange malaise struck the market by the end of 2015. Despite being a relatively small and massively under-penetrated Internet retail market, Indian ecommerce began to slow down rapidly by the last quarter of 2015. By the first half of 2016, this has become a full-blown crisis as sales came to a complete stall. Growth expectations hastily began to be reset.
The narrative shifted nearly overnight as well with the euphoria of the previous year sharply changing into unbridled pessimism and serious questions about the sustainability of any form of Internet retail in India. By mid-year, it was clear that new ecommerce user growth had essentially stalled, and the frequency of shopping and the average ticket sizes were not growing fast enough, especially given the small size of the base and the often stated large potential of the market.
The reasons for the sudden slowdown are too many and too complex to cover comprehensively in a single article — unclear regulation, a consumer base unfamiliar with online commerce, over-competition due to too many players being funded in the same industry, leading eventually to poor unit economics for all players and so on.
2017: A New Hope
While the year has not played out yet — two things happened!! Reliance Jio and the massive funding of Flipkart by SoftBank just before Diwali, a peak shopping season for India.
While we believe that ecommerce markets and Internet businesses around the world evolve uniquely depending on local circumstances and consumer needs there actually are a few fundamental threads that link them all. This article examines some of the most important metrics that characterize successful and sustainable Internet businesses.
This article examines some of the most important metrics that characterise successful and sustainable Internet businesses.
Let’s dial back ~10 years!
Circa 2008: We’ve seen this movie before.
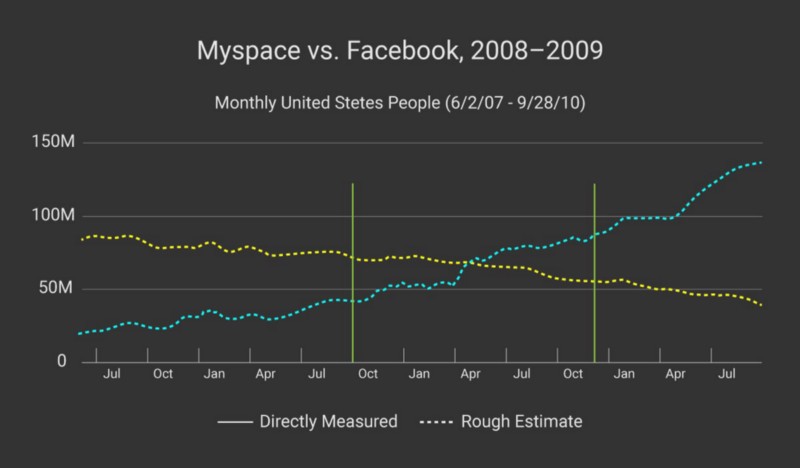
We begin our analysis by going back in time to 2008. Back before it became the behemoth it is today, Facebook was locked in a battle with Myspace for dominance in the US social media market. Myspace, the leader with market share of ~66% in the 3rd Quarter of 2008 had the upper hand on Facebook, a distant second with ~30% market share. MySpace spent much of its time boasting about its massive and increasing installed user base. Facebook, by comparison, was (then) much less visible in the press. When it spoke it referred only to its Monthly Active User (MAU), completely eschewing the installed user base metric.
Over the next 12 months, a curious turn of fortunes took place. By the late summer of 2009 Facebook and MySpace’s market share had almost exactly reversed from 2008 (See Figure 1).
Scale: It’s all about retention, stupid!
An Internet-age Tolstoy might say that all successful Internet businesses are alike; every unsuccessful Internet business is unsuccessful in its own way. Unsurprisingly, Internet businesses, whether they sell products, services or advertisements succeed based on the same factors that traditional brick and mortar businesses do.
- Is your product solving a unique issue? (Product Market Fit)
- Do you know who your target market is? (Product Market Fit)
- Are you able to reach them effectively? (Customer Acquisition)
- Are your users returning regularly to your business/product/service? (Customer Retention)
Let us go back to the comparison of Facebook and Myspace.
Both companies had demonstrated clear Product Market Fit. There was a clear user need for social networks where they could discover friends, share and consume content with them and update each other on the minute details of their lives.
MySpace, by focussing on its installed user base (i.e. the number of registered users on its platform) seemed to clearly know its target market and, as the numbers suggested, had little difficulty reaching them.
Facebook on another hand, by focusing heavily on monthly (or daily) active users (MAU and DAU respectively) was focussed on figuring out how to keep users returning regularly to the platform.
The differences may sound trivial but had profound effects on the way the companies thought about their long-term growth. The MAU/DAU focus at Facebook was targeted at long-term customer retention. Facebook was figuring out how to make their product useful enough for its users to keep coming back regularly and voluntarily without an external push.
MySpace’s installed user base focus, on the other hand, was all about customer acquisition. The focus on this as a core metric allowed the company to register massive growth early on as it continuously looked for ways to keep bringing new users to MySpace for the first time. Over time though this same metric quickly became a ‘vanity’ metric, failing to tell the MySpace management team anything useful about the stickiness or usefulness of its product to its users. Customer acquisition had become a counterproductive and plainly dangerous metric leading to destructive behaviour. Why?
As an example consider a mobile application product company where growth is equated to mobile installations. The marketing department, under tremendous pressure from the company’s investors and increasing competition, finds the path of least resistance by offering incentives to potential customers to install the application in the form of discounts, gifts and cash bonuses. At no point does anyone within the company think about the quality of the customers being acquired, their ability or willingness to use or pay for the product in the absence of the discounts and ultimately, the underlying quality of the product itself!
There are a couple of nuances that are important to understanding in this context. First, the switching cost for a customer of an internet business, especially in ecommerce is often very low, since browsing is essentially free. Second, while rapid customer acquisition (represented by metrics like installed user base) is important in the early days of internet businesses to demonstrate product-market fit it can become debilitating metrics once a business acquires scale. There are a time and context for each metric: businesses not only need to evolve their strategy as they enter different phases of their growth but also need a laser focus on the metrics they would use in terms of measuring themselves.
Retention : Down the rabbit hole
The retention rate measures how many of a company’s customers on any given date will reuse its product/website/platform/service within the next 30/60/90/365 days and so on.
Let us consider a hypothetical ecommerce company — Deals Everyday and All Day, or as it is better known to its users, the fawning press and marquee pension fund investors, dead.com (NASDAQ: DEAD).


For simplicity, let’s assume 10,000 customers purchased a product on dead.com on January 1st 2016.
In Figure 2 below, the number at D1 (“Day 1” or January 1st, 2016) is at 100% and represents the 10,000 users who formed a “cohort” or a group of people who shopped on that day. We subsequently measure the percentage of people within the group of 10,000 of the January 1st cohort who shopped in the first 30 days (Jan 2–31), 60 days (Feb 1- March 1), 90 days (March 2–31) and so on to get a sense of users’ engagement with the company.
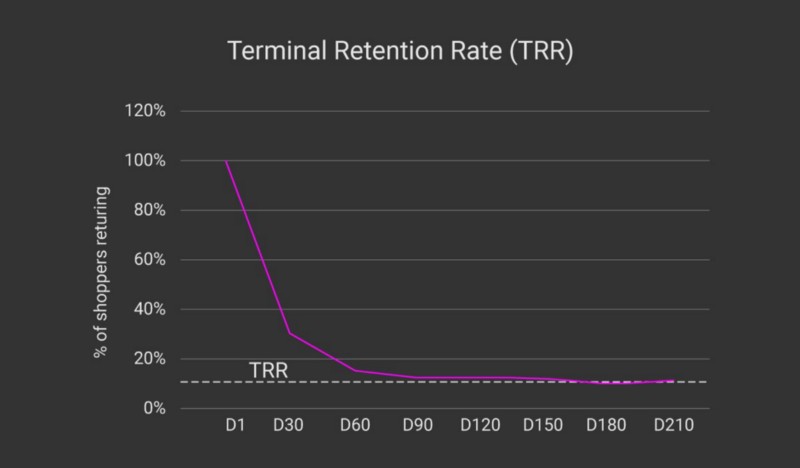
In the figure above we see that ~30% of the initial cohort of users return to the platform in 30 days. Approximately 18% return within 60 days and so on. The point at which the retention curve becomes parallel to the X-axis is called the Terminal Retention Rate (TRR).
The terminal retention rate is an indicator of the steady-state engagement of the users with the product. In this case, we see that dead.com has a terminal retention rate of approximately 16%. This means that 16% of the users acquired on a given day can be expected to shop within a given 30 day period in the long run.
From this analysis, it also becomes evident that the greater the TRR the higher the likelihood of success of the Internet business. Businesses with very low TRRs have issues retaining the customers they acquire, requiring them to continuously and (often) expensively keep re-acquiring customers.
Hence, the Leaky Bucket!
The Wrong Kind of Right
So what really happened in the Indian ecommerce market in the last year? To understand this better we return to the world of hypothesis.
Once again consider two hypothetical ecommerce companies:
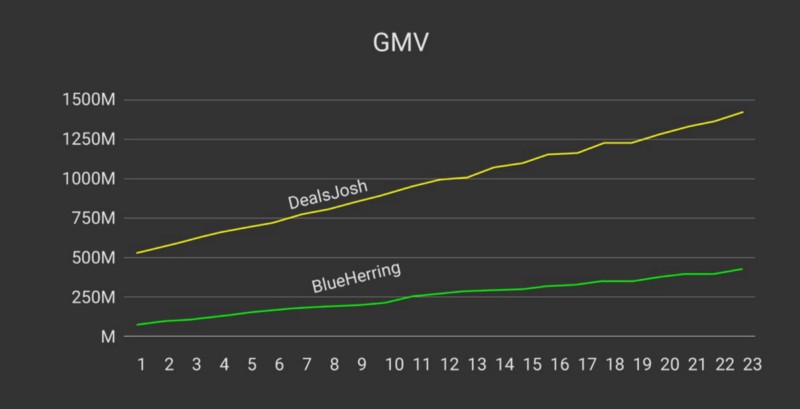
- DealsJosh is a large multi-category online marketplace which sells largely standard, high volume categories of products like consumer electronics and books. With attractive discounts and promotional events, DealsJosh has a user-base of 100,000 users with monthly sales (GMV) of Rs 525 Million (52.5 crore).
- BlueHerring is one of the smaller players in the industry, focusing on selling only clothing and accessories. In the simulated scenario, BlueHerring has a user-base of 50,000 users with monthly sales of Rs 70 Million (7 crore)
Because BlueHerring’s product category is limited to fashion, the average transaction size on its platform is lower at ~Rs 1,400 but its users tend to buy more often — approximately once in every three months on average. DealsJosh, by comparison, sees average transaction sizes of ~Rs 5,000 because of all the phones it sells but most people buy one only once a year, with some even less frequently.
The year is 2013 and DealsJosh is over seven times the size of BlueHerring and has grown sales remarkably over the last year, by over 150%. Investors are lining up and growth seems never-ending. It appears that people simply cannot get enough of shopping on the platform.
PlotDevice’s team is busy patting itself on the back for an excellent two years of GMV growth. Internally as well the message to its teams is clear — to lead the market in sales and keep up the market share growth. But as we examined earlier in this article GMV is a dangerous metric.
Let’s look at the user-base growth numbers. Recall that in the beginning, PlotDevice had twice as many users as RedHerring. However, because a larger percentage of RedHerring’s users shop regularly for clothing it’s user base grows faster over a longer period of time. In this simulation, near the end of the second year, RedHerring has 14% more users than PlotDevice.
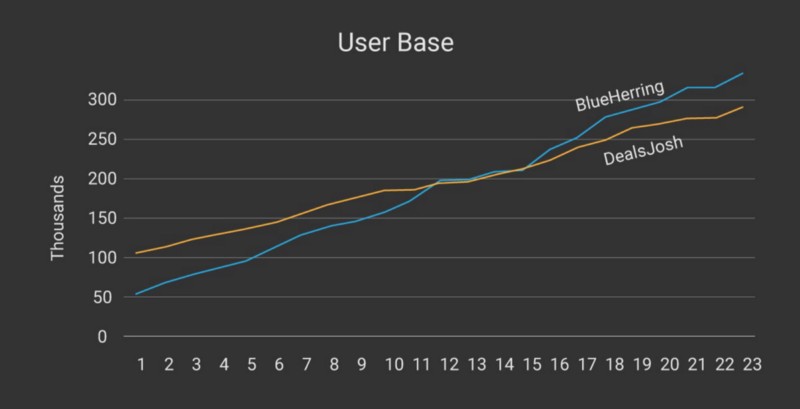
Note the eerie similarity of this much simplified hypothetical scenario with the Myspace vs. Facebook battle in 2008.
[Note on the graphs. The key difference is that PlotDevice has a TRR of 8.3%, which is typical for higher priced, mobile-led categories, while RedHerring’s TRR is 25%, typical for lower-priced, consumer fashion and apparelled categories. A smaller difference in the TRR would have had the same effect, but taken a longer time. The small bumps are random noises added to make the lines look more realistic]
Let us point out again that this a vastly simplified view of an extremely complex market. We assume PlotDevice to be static in its strategy of selling only high volume, standard products. In reality, every “horizontal” (used in place of multi-category) internet retailer would quickly look to expand categories and even into the space of the RedHerrings of the world to gain user retention. What it does indicate though, is how a single-minded focus on an acquisition metric — in this case GMV — can lead to strange outcomes.
If the market rewards top-line performance alone, failing to adequately examine secondary and (in our view) more important metrics like retention, incentives can make teams go hell-for-leather for growth through discounts, cash back schemes, and special offers to boost GMV but do nothing for real consumer loyalty. The only rationale offered in such situations especially when complicated further by the presence of other competitors is the one of “last-man-standing”; that only one of several players can afford to keep spending cash endlessly on this expensive acquisition and re-acquisition spree until finally becoming the only game in town.
Given the relative lack of depth in ecommerce in 2013, it made sense for PlotDevice to follow an acquisition strategy. By selling easily comparable, transparently priced products with clear quality guidelines, PlotDevice was able to expand the size of the first-time buyer market in India. But by staying focused on sales and GMV, driven by pressures to grow and raise greater capital to fund greater expenses to drive greater growth in the face of increasing and aggressive competition, PD in our example can quickly find itself unable to shift away from its bread-and-butter categories. The loss-leaders will overstay their welcome.
The question at this juncture that is worth asking is: how did it all go so wrong for a brief period? Given that GMV is not the rights metric of success (now widely admitted to by all of India’s ecommerce companies) what did the pursuit of it achieve? How did the several billions spent for customer acquisition impact the behavior of Indian consumers? What now?
The Economics of TRR
The following table demonstrates a simple scenario of a company with 100 customers. In this example, the Customer Acquisition Cost (CAC) is the money spent to acquire one customer, typically an incentive such discounts, free add-on products on a purchase, sign up cash (consumer wallets), first “free” ride (Uber) etc.
The Annual Lifetime Value (A-LTV) is the annual profit the company derives from one customer.
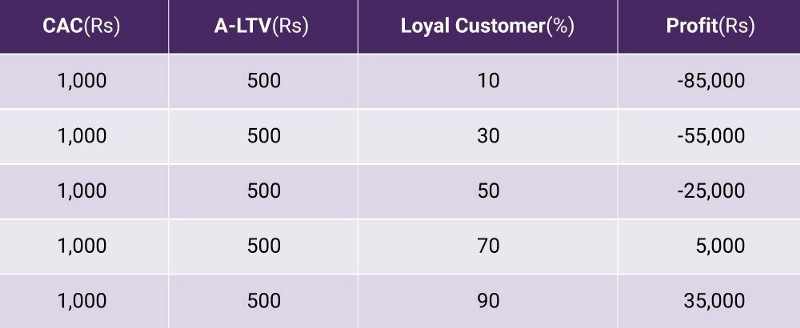
The table clearly demonstrates that even with a high percentage of loyal customers, profitability is not easy to achieve. However, not having a large loyal customer base definitely makes it all but impossible to create a profitable or sustainable business.
Unfortunately in a multi-player market with mostly undifferentiated product selection and relatively standardized pricing even, players are locked in an endless and expensive war of attrition to constantly reacquire this group of consumers.
Does Retention Really Matter?
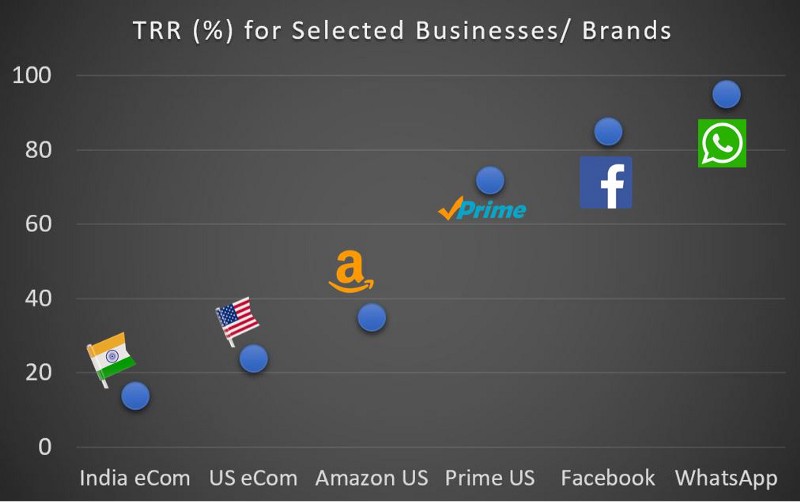
To answer this question, see Figure 4 where the estimated TRR for selected businesses/brands are shown. To demonstrate what a well-designed retention program can do for a business, let’s look at Amazon Prime’ case. Amazon Prime is a paid subscription service offered by Amazon.com that gives users access to free one-day delivery, streaming video/music and other benefits for a fee. Since users have already paid for the subscription they tend to come back more often than the regular customers of Amazon. The TRR for Amazon Prime is estimated to be twice as much as the Amazon.com users
How did the improved TRR for Prime help Amazon grow its business?
- Prime members spend more with Amazon than non-Prime members. Prime members spend an average $1,300 per year compared with $700 for non-Prime members.
- Prime members grew 38% year-over-year (YoY) in Q1 2017 and 60% of Amazon’s US customers now have Prime membership
- Prime’s growth has helped fuel the Amazon’s rapid success in recent years, turning it into a dominant force in the US ecommerce sector with a 43% market share
So, in short, retention does matter!!
Ecommerce: Quo Vadis?
Starting in 2016 we began to observe major incremental focus from almost all of India’s leading ecommerce companies on customer experience and customer retention. GMV has lost its shine as the metric of choice with NPS and customer satisfaction score becoming headline news. We are also witnessing slowdown in spend-driven acquisition with discounts becoming both less frequent and less significant.
These are worthwhile efforts are indicate clearly a new focus from all of the major internet retailers in India on long-term customer satisfaction and retention. While the step is definitely in the right direction, weaning entire organizations, the national press, and hungry investors off the GMV drug will be easier said than done. These are precisely the pains of growth and maturity though. The road ahead will be full of challenges.
- To succeed with TRR-based marketing and planning a business has to invest very deeply in understanding its customers’ product preferences, buying habits and service expectations (among many other things) to ensure that they come back repeatedly and add towards profitability.
- There remains the unenviable task of motivating and moving massive organizations of tens of thousands of people towards new customer-focused metrics, recasting internal processes and reporting and re-jigging incentives for employees, customers and merchants to align with long-term satisfaction
In summary, not focusing on the right growth strategy and not managing the fine balance between rapid customer acquisition and enduring customer retention can be fatal. We saw this earlier in the article with the MySpace/Facebook example in 2008 and illustrated this through multiple examples (Dead.com, PlotDevice and RedHerring).
Organisations are living entities where people, structures, processes, and incentives are set up to steer a giant ship in specific directions. Changing direction after building habits and behaviour within and outside the organization is hard. Not doing so when necessary, though is an existential threat.
We believe that the Indian ecommerce ecosystem has been lucky to learn this lesson at a relatively early stage in its evolution. The challenge is not so much one of radical surgery as it is one of rapid evolution. Whatever the case may be it is clear that “Customer is King” is the new mantra of the industry. Whether this is achieved individually by each company or through mergers, divestitures of unnecessary assets or fundamental changes in core strategy (or even death) is a story for another day.
About The Author
Santanu Bhattacharya is a former rocket scientist, crazy for all things data, startup founder, ran Products at Facebook and future settler at Mars or Tatooine. Follow him on Medium.