


Inc42 Daily Brief
Stay Ahead With Daily News & Analysis on India’s Tech & Startup Economy
This article is part of “The 3 Step Process To Raising Seed Money For Your Startup” where we will be step by step discussing how prepare your pitch deck.
“If you got it, flaunt it”, would be the best way to talk about the traction slide on your overview. In fact, show it early, often since in the absence of other stronger parts of your business, traction trumps theory.
Progressively, % growth is the easiest to show if you have small numbers or have numbers other than revenue. The next best is to show the revenue curve (up and to the right hopefully) followed by revenue with some key snapshot metrics.
The thing you are trying to do with the traction slide is to prove that you have validation in the market. Hence, showing traction in the short term with users, or longer term in terms of growth is a good start, but traction with revenue and key metrics is the best place to be. See the slide example below.
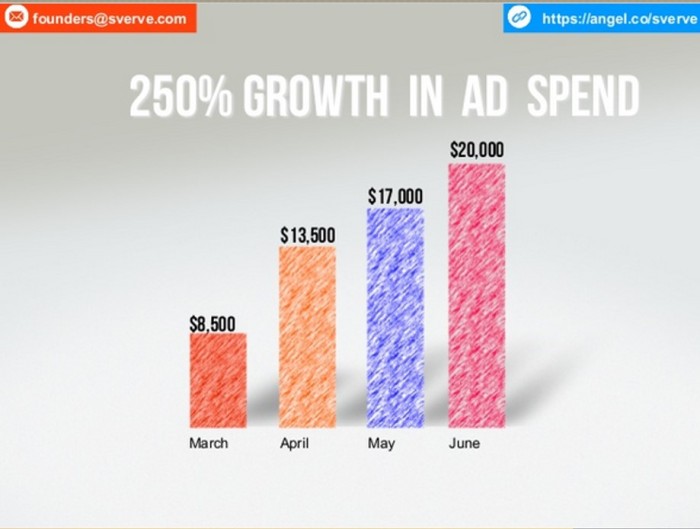
If your model shows # of advertising revenue spend on your site (for e.g. media property, blog, etc.) then, ad spend on your site with key metrics about user engagement, etc. make sense.
For most SaaS businesses, though, showing revenue over a decent period of time (1 year preferably) or at least since the time you started getting revenue along with growth rates helps.
I am not a fan of using snapshot based traction, since it tends to obfuscate the growth and also does not help the investor figure out the lines from the dots. You want them to get a sense that your business has been growing for a good period of time. In the absence of having strong growth metrics, I’d still use some numbers.
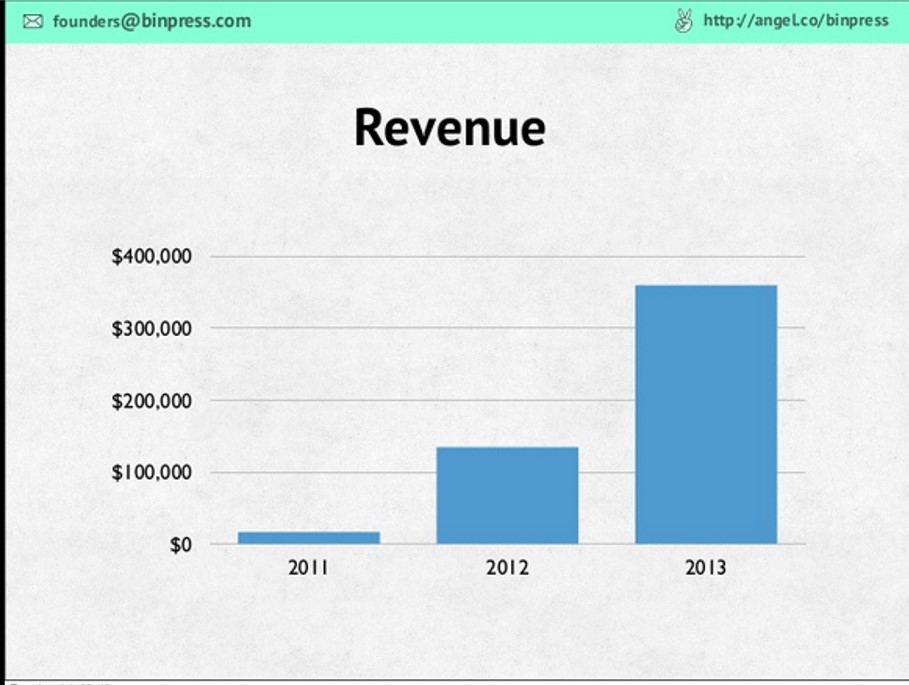
Absolute revenue graphs are good as well, but I’d advice most folks to show % growth and keep the numbers private to be shared during your operating plan discussion. You dont want to give any of your competitors or investors in your competitors, any knowledge of the strength of your business.
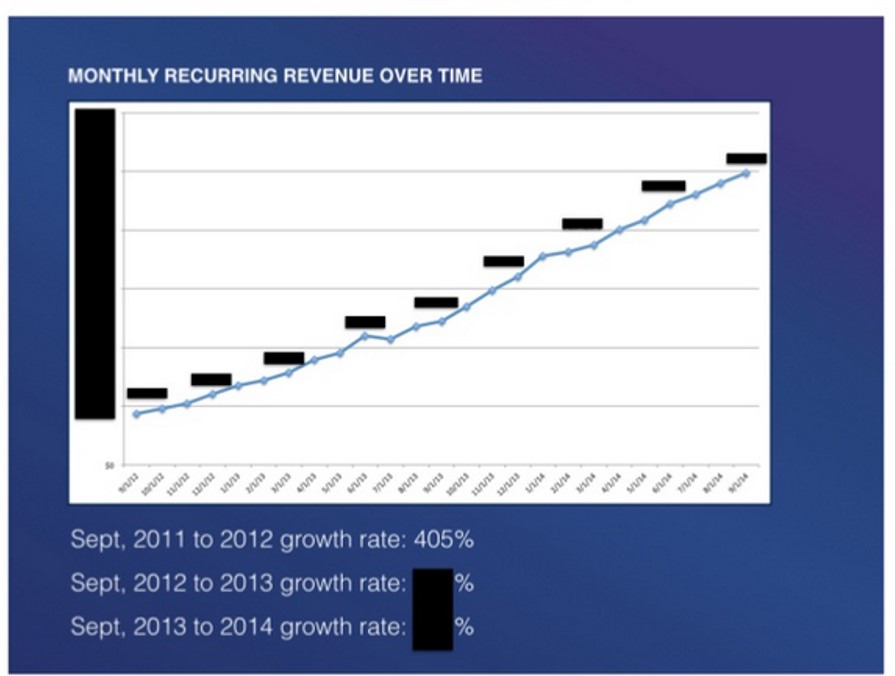
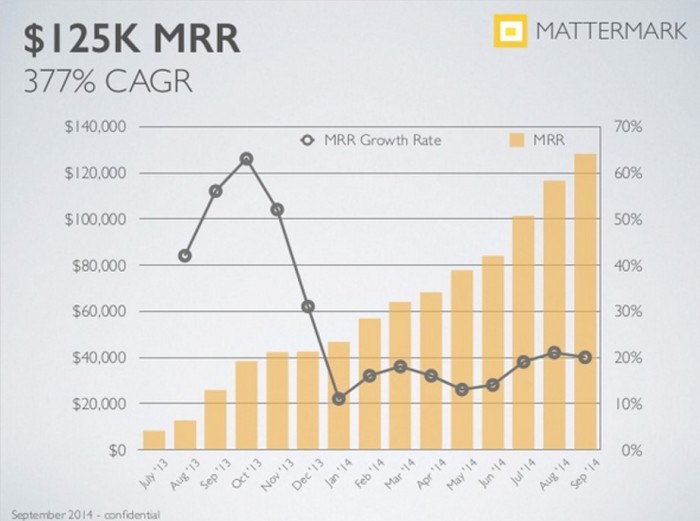
The graph above has the revenue and mentions growth rate, but I prefer to show them next to each other as MatterMark has done before.
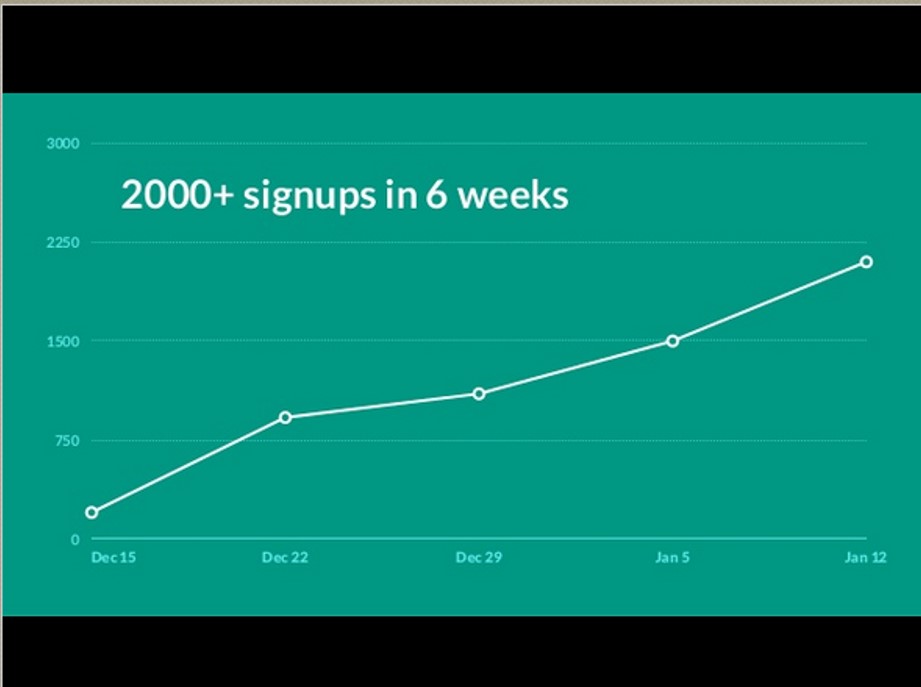
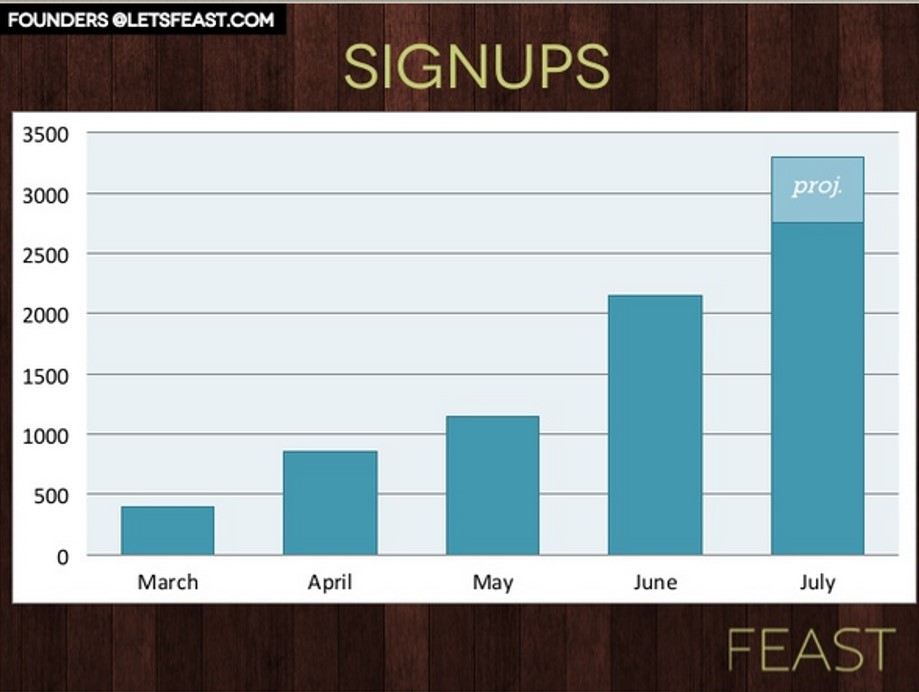
Sometimes when your business is fairly recent, and your product depends on user growth initially, not revenue, you could use either the monthly signup graph or bar chart.
Above all I’d say the #1 tip for your traction slide is to focus on the headline, once your decide which metric to show. The title of your slide show tell the user about exciting development in your business from a traction standpoint.
So, instead of using words like traction, revenue, signups, etc. I’d say
1. 40% growth in user MoM, for 8 months
2. 212% growth in revenue YoY, at $500K
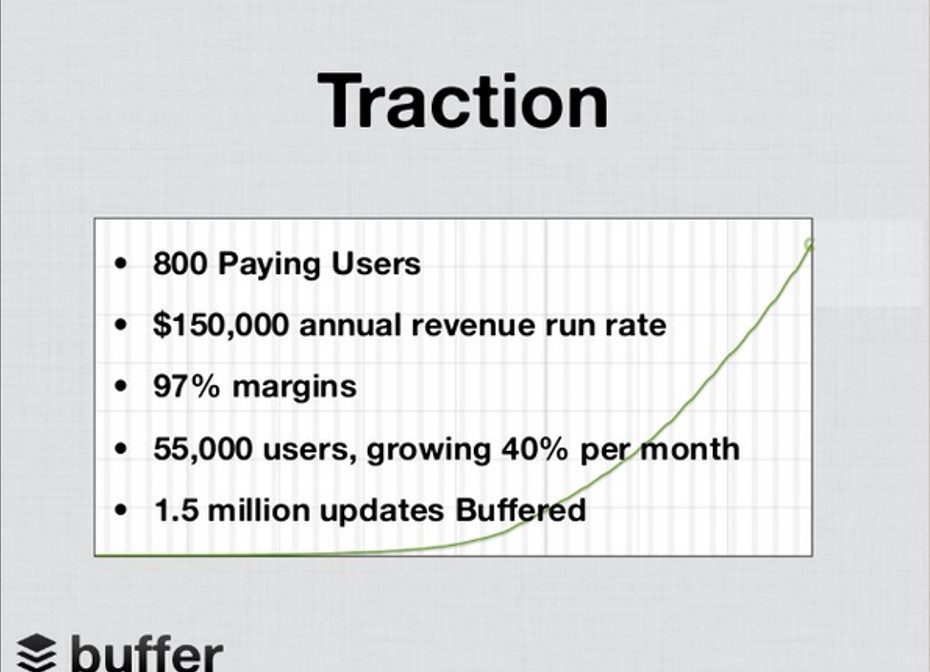
3. $150K revenue, 97% Margins, 40% growth in users MoM
That way, even if the audience is glancing back to their smart phone, they got the key takeaway that you were trying to convey.
Related: [ Pitch Deck ]: How To Present The Market Slide In Your Deck
Note: We at Inc42 take our ethics very seriously. More information about it can be found here.