


The one thing I observe is common across most successful entrepreneurs is that that they doggedly watch their business metrics. And they do this to identify key challenges, seek help from investors / mentors quickly without mincing words. They then employ some of their best brains to address the right problems to come up with strategic initiatives and to measure outcomes and finally, celebrate the small successes along the way.
Rinse, Lather, Repeat….
In order to run the above mentioned loop efficiently, it’s rather critical that the business health is measured on the right metrics. At a 10,000 feet view, the key goals for any marketplace business are Liquidity cum Leadership, Growth, Cash, and Profitability (more on marketplace liquidity here). The following attempt is to build a comprehensive metrics sheet based on the above mentioned goals and more importantly, understand the What, When and Why of each of these metrics.
I would split the life of an online marketplace into two important phases – ‘Pre-Liquidity’ and ‘Post-Liquidity’.
Pre-Liquidity Stage
The only thing that matters in the pre-liquidity stage is – achieving liquidity ahead of competition and assuming market leadership position in the shortest period of time.
The idea of liquidity is simple – are customers finding what they are looking for in a super-efficient / convenient manner (More on value proposition for the demand side here) and are suppliers finding the platform an effective (cheaper source of customer acquisition, convenient to sell, payment terms. More on this here) channel to sell. Following are some of the metrics you need to follow closely during this phase –
Demand Side
- Conversion – before you start tracking conversion, it is extremely important that this metric be defined as per the primary business goal – be it transactions, leads, engagement or any other activity on the platform which can be proven to have a direct impact on the company’s top / bottom line. Mathematically, it is the ratio of new converted users to the number of unique visitors to the platform. This is the single most important metric during this phase as this is testament to the fact the consumers are finding what they are looking for / or doing what you expect them to do.
- Usage metrics – repeat behavior, depending on the product / service category, is another key metric to measure. The best way to measure repeat behavior is on the basis of cohorts which in order to avoid repetition is best explained in detail in the post-liquidity section below.
- ‘Word of Mouth’ led consumer acquisition – one thing common across leading consumer internet companies globally is the strong ‘word of mouth’ led consumer acquisition that kicks in early in the evolution of the company. This is driven by a seamless consumer experience which in most cases is driven by the product experience. Unpaid traffic to the platform is a key metric to follow here.
- What’s the buzz on social networks? – The two way feedback forum on social channels is a simple and effective channel for companies to listen and interact with the users. Keeping a close eye on the reviews is critical.
Supply Side
Supplier usage metrics – this is a great parameter to assess platform liquidity health. Track supplier behaviour on the platform. Examples (Disclosure – the following are Bessemer portfolio companies) –
- The number of travel requests served by travel agents on the Travel Triangle agent CRM (supply side product) continues to grow at a frenetic pace highlighting a highly engaged travel agents on the platform
- The active hours per cab per day driver had increased rapidly for TaxiForSure (Now OlaCabs)
- The active hours per beautician per day continues to increase rapidly for StayGlad
- Vendors are building dedicated supply for the BigBasket platform
- Suppliers are calling to be on-boarded on the platform – strong indicator of platform health – you will know when this is happening and your supply onboarding team is always falling short of hands! (Amen J)
Most of the above mentioned metrics should be moving fast to the top right of the chart – if not, its a good time to go back to drawing board in terms of product and value proposition.
One of the mistakes, startups make during this period is to keep take rates (commission) high during this period. This is a recipe for disaster on two fronts –
- Negative impact on liquidity – higher take rates will push the suppliers concentrate time and energy on other platforms or look for means to disintermediate the platform.
- Competition can kick-in with a lower take rate.When ebay entered China, JackMa made Taobao free of cost for the sellers on the platform (this came with severe backlash as JackMa was called CrazyMa during this period) to ward off the US giant. The result is in front of everybody to see. Successful marketplace businesses enjoy disproportionately high market share at scale and that is the opportune time to increase take rates!
Post-Liquidity Stage
The ‘post-liquidity’ phase involves two important things (1) To acquire consumers in the most capital efficient manner and then retain them to maximize customer life time value and in the process drive growth, capital efficiency and profitability (2) Continue to do whatever is takes to keep liquidity intact !
Growth
Growth = finding and scaling new consumer acquisition channels + Retain customers + Getting repeat customers to spend more on the platform
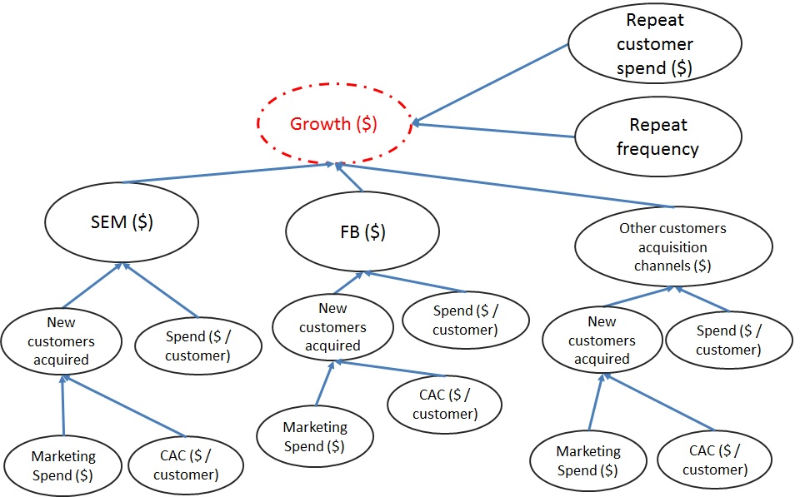
While most this is self-explanatory, following are some of the key tenets to keep in mind as you come around scaling the marketplace –
- Experiment with as many customer acquisition channels as possible – for some inexplicable reason, I observe entrepreneurs to be stingy during this stage (even post funding), which can result in loss of leadership position in the market and a downward spiral in platform liquidity (read ‘Disaster’) – If you don’t test the acquisition channel with a critical amount of marketing spend, you will never know if it works or not. The metric to decide if the channel is working is the ratio of customer lifetime value (CLTV) to customer acquisition cost (CAC) (more on how to measure this below). These metrics need to be measured doggedly for every channel as it determines marketing dollars allocation. Keep in mind that the efficiency of every channel decreases over a period of time and hence, the marketing dollar allocation needs to change. Finally, the pursuit for new acquisition channels needs to continue.
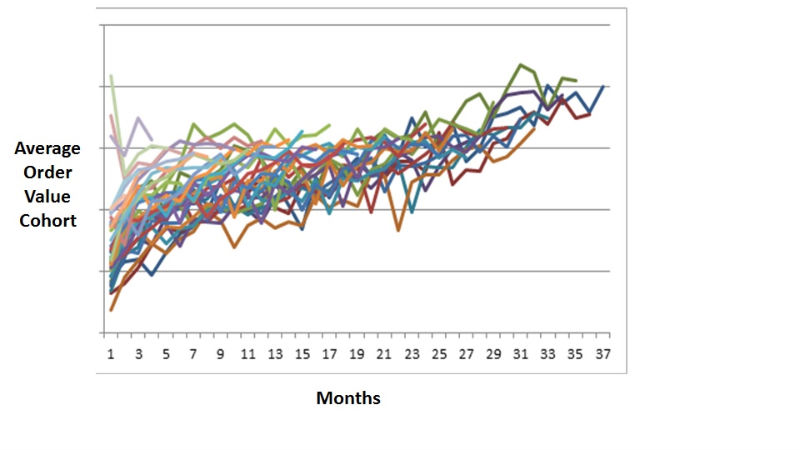
- Repeat customers – ability to sell more to the returning user can be golden for CLTV and for overall profitability. For most categories, it is quite natural that repeat customers who now trust the platform and realize the value of the platform, continue to come back to spend more on the platform – you need to think hard if it is not happening on the platform. The metric to track is customer retention and average order value cohorts. Following graph is an example of a cohort for average order value for a transaction led marketplace that depicts that customers who continue to stay on the platform spend more on the platform. Growth is naturally built-in in this case!!


Before we jump into the concept of capital efficiency and profitability, it’s important to understand the drivers for CLTV and CAC.
Customer Lifetime Value
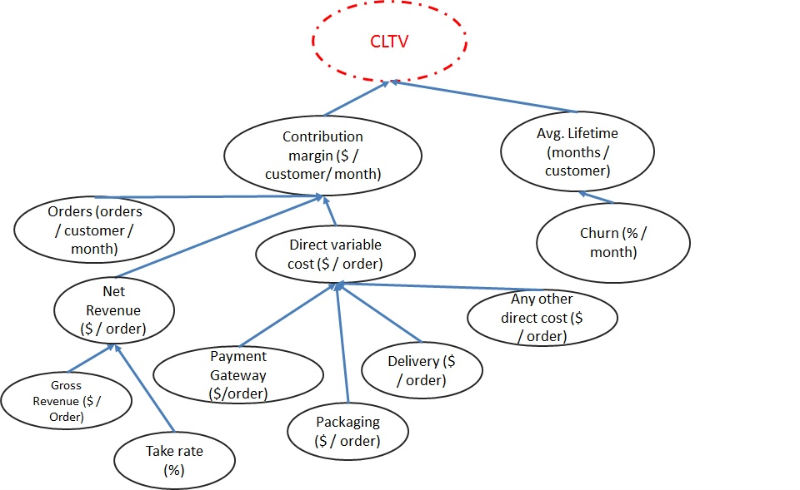
CLTV = Contribution margin ($ / customer / month) * Avg. customer Lifetime (months)
Contribution Margin ($ / customer / month) = (Net Revenue – Direct costs)* (Orders (orders / customer / month))
Avg. Lifetime (months) = 1/churn (%)
Key driver of CLTV is Average customer lifetime (is 1/churn (%)) – track consumer churn (see Measuring Churn section below) doggedly to understand how consumers are reacting to the product value proposition. Some consumers will churn lesser than the others – identify the common thread across these consumers and optimize marketing campaigns to acquire more of them.
Measuring Churn
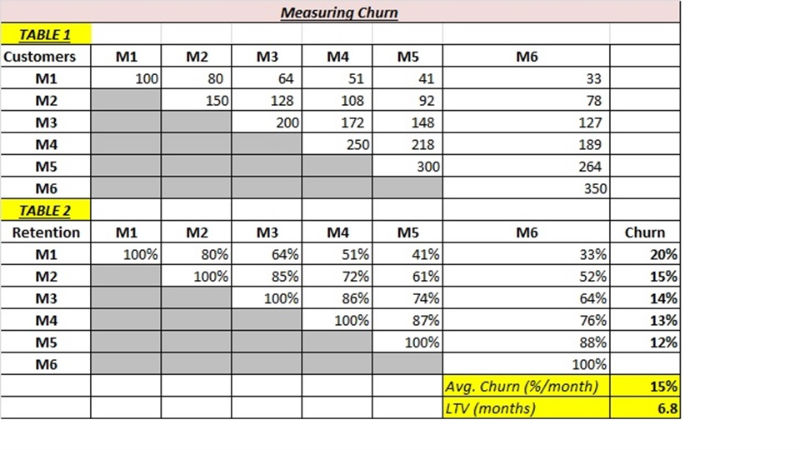
Table 1 depicts the transacting customer base for a marketplace. The way to read this is to look at the first row – the line tells us that the business acquired 100 customers in the first month and out of those only 25 remain after the 6th month. And similarly, in month 2 the business acquired 150 new customers and out of those only 78 remained after 4th month. Essentially, this is a customer cohort which allows us to study the behaviour of a particular set of customers over a period of time. Table 2 tells us what % of consumers remain after a period of time. Mathematical equation for Churn tells us the consumer decay rate –
Churn = 1 – (% customers remaining)^(1/(months-1))
As you analyze these cohorts it is essential to measure churn across consumer cohorts which is showing a positive trend as the consumer churn is reducing. Average churn is 15% per month (which is extremely high and this is a leaky poor business!) which represents a life time value of 7 months – you don’t wish to be in a business wherein the consumer is expected to stay for 7 months !!
Consumer Acquisition Cost
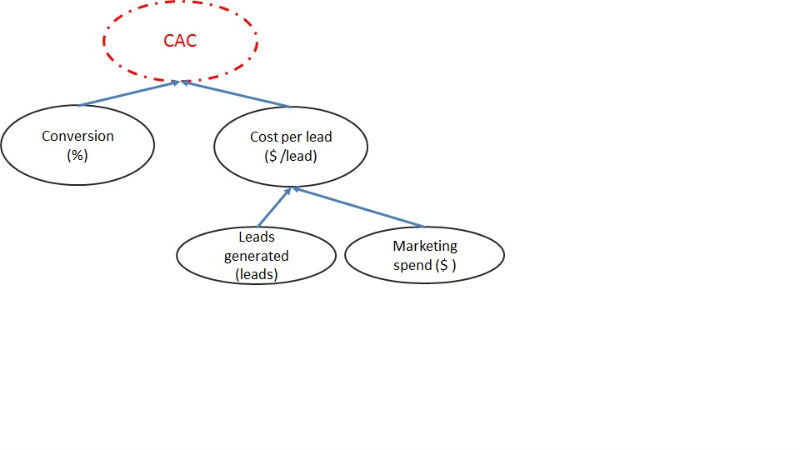
CAC = Cost per lead ($ / lead) * Conversion % (leads to consumer conversion)
At the cost of repetition, continue to track leads to consumer conversion metric. Track campaigns / common thread across consumers who convert better and optimize marketing dollars to acquire more of such consumers.
Driving Capital Efficiency & Profitability
- Capital efficiency is best understood in terms time taken to recover CAC from Contribution Margin or CAC Payback period.
CAC Payback period (months) = CAC ($ / customer) /ContributionMargin ($ / customer / month)
Businesses that recover CAC in less than 1 year tend to be very capital efficient and hence, can scale to higher revenues with same amount of capital as compared to those businesses with longer CAC payback period. There are a bunch of businesses that have longer CAC payback period but compensate with higher a (CLTV-CAC) – such businesses take more capital to scale but are eventually highly profitable. That leads me to the next point – Profitability.
- Profitability is the difference between CLTV and CAC. Idea for the business is to maximize difference between CLTV & CAC using multiple levers as mentioned above.
In summary, liquidity cum leadership is supreme – continue to measure and improve liquidity by measuring demand and supply side engagement. Growth, capital efficiency and profitability to follow through scaling multiple consumer acquisition channels, maximizing CLTV through higher consumer retention and minimizing CAC through better conversion (%). RINSE, LATHER, REPEAT !!
[Disclaimer: The views expressed here are solely those of the author in his personal capacity and do not in anyway represent the views of the organization.]