SUMMARY
All findings are only based on P2M transactions for UPI alone held on Razorpay platform in September 2019
By 37.33%, UPI went through the roof in September, for the first time ever
Bengaluru gobbled up the first place as the city pitched in 39% of UPI transactions.


UPI, since its inception, has become quite the champion amongst payment modes in India. Anybody and everybody who accept payments, are now providing UPI as a default payment mode. Also, Indian consumers are catching on to the bandwagon of a digitised country, embracing digital payments more than ever, specifically leading to increased UPI transactions.
So, if you’re wondering what UPI has to offer in September, you’re in for a treat! Without further ado, let’s discuss UPI, the most preferred payment mode in India!
Before we get into the details, let’s bounce off of the different types of UPI payments and their significance.
Although the use-cases for UPI payments are bountiful, we primarily use the payment mode for two kinds of payments.
- P2P (Person to Person) – UPI was initially a P2P payments enabler in 2017, meant for transactions between two people
- P2M (Person to Merchant) – After it took the payments space by a storm, it transitioned into a P2M mode, wherein people could make payments through UPI to merchants, both online and offline
UPI vs Other Payment Modes
For the first time ever, UPI went past cards and other popular modes to become the most preferred payment mode in the month of September!
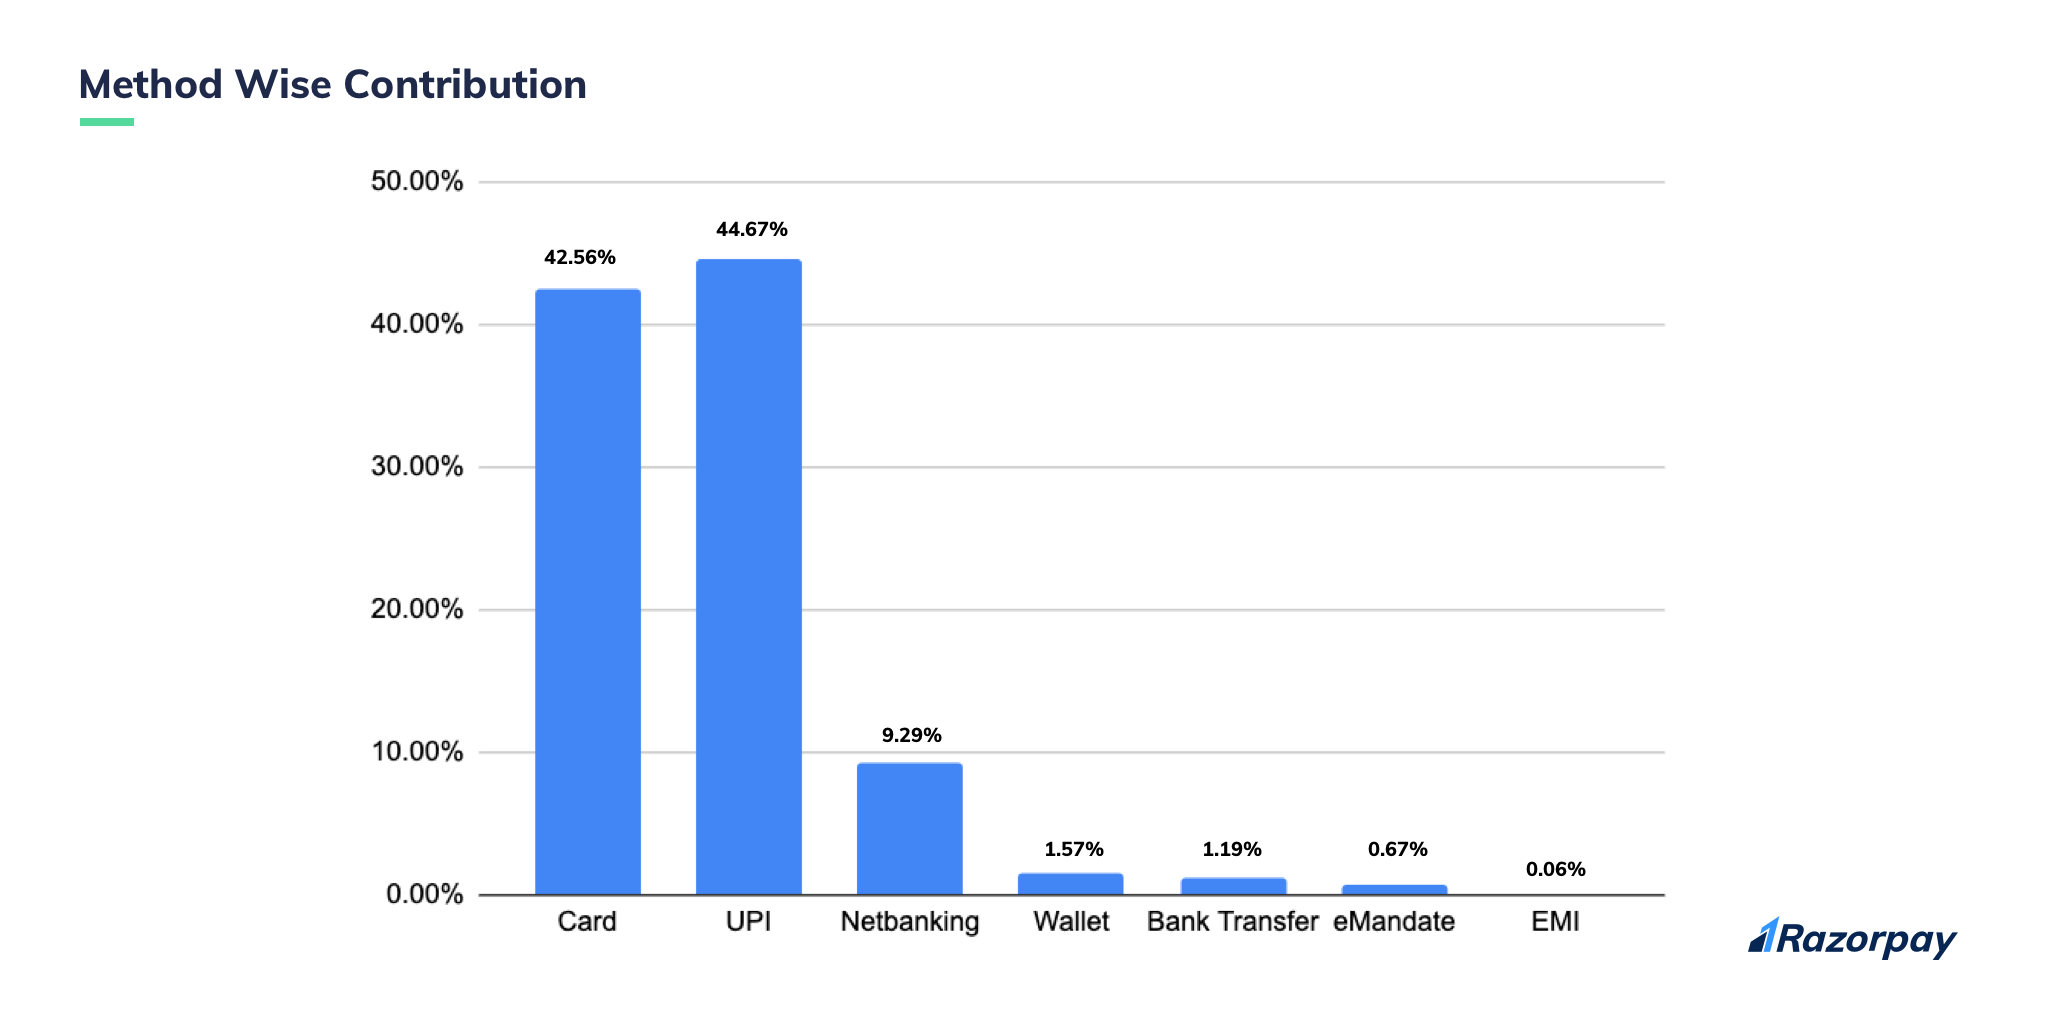
We’ve been observing UPI transactions since 2017, and we always saw that cards (debit & credit) took the bigger chunk in the method-wise split, while UPI always stood right behind cards. But, the tables turned in September.
UPI contributed to about 45% of the total transactions, while cards pitched in 42.56%, taking the second place.
You may think the difference is minuscule. But, with 350,000+ businesses on the platform, you can only imagine the number of transactions taking place every minute, every day. So, the 2% difference is a big deal.
As much as people love swiping cards, the ease of simply not carrying cards anymore took precedence.
Netbanking summed up a total of 9.29% as wallets superseded bank transfers by 0.38%.
UPI Transactions Jumps Up By 37.33%
In our August month’s issue, we talked about UPI’s adoption skyrocketing. And, it’s no different this time either!
The growth of UPI is always an interesting trend to stay updated with. We’ve seen the numbers vary across ranges and extremities.
The payment mode is truly an innovation in fintech since it has been able to simplify payments like never before. And this very fact makes its elevation an exciting trend to observe.
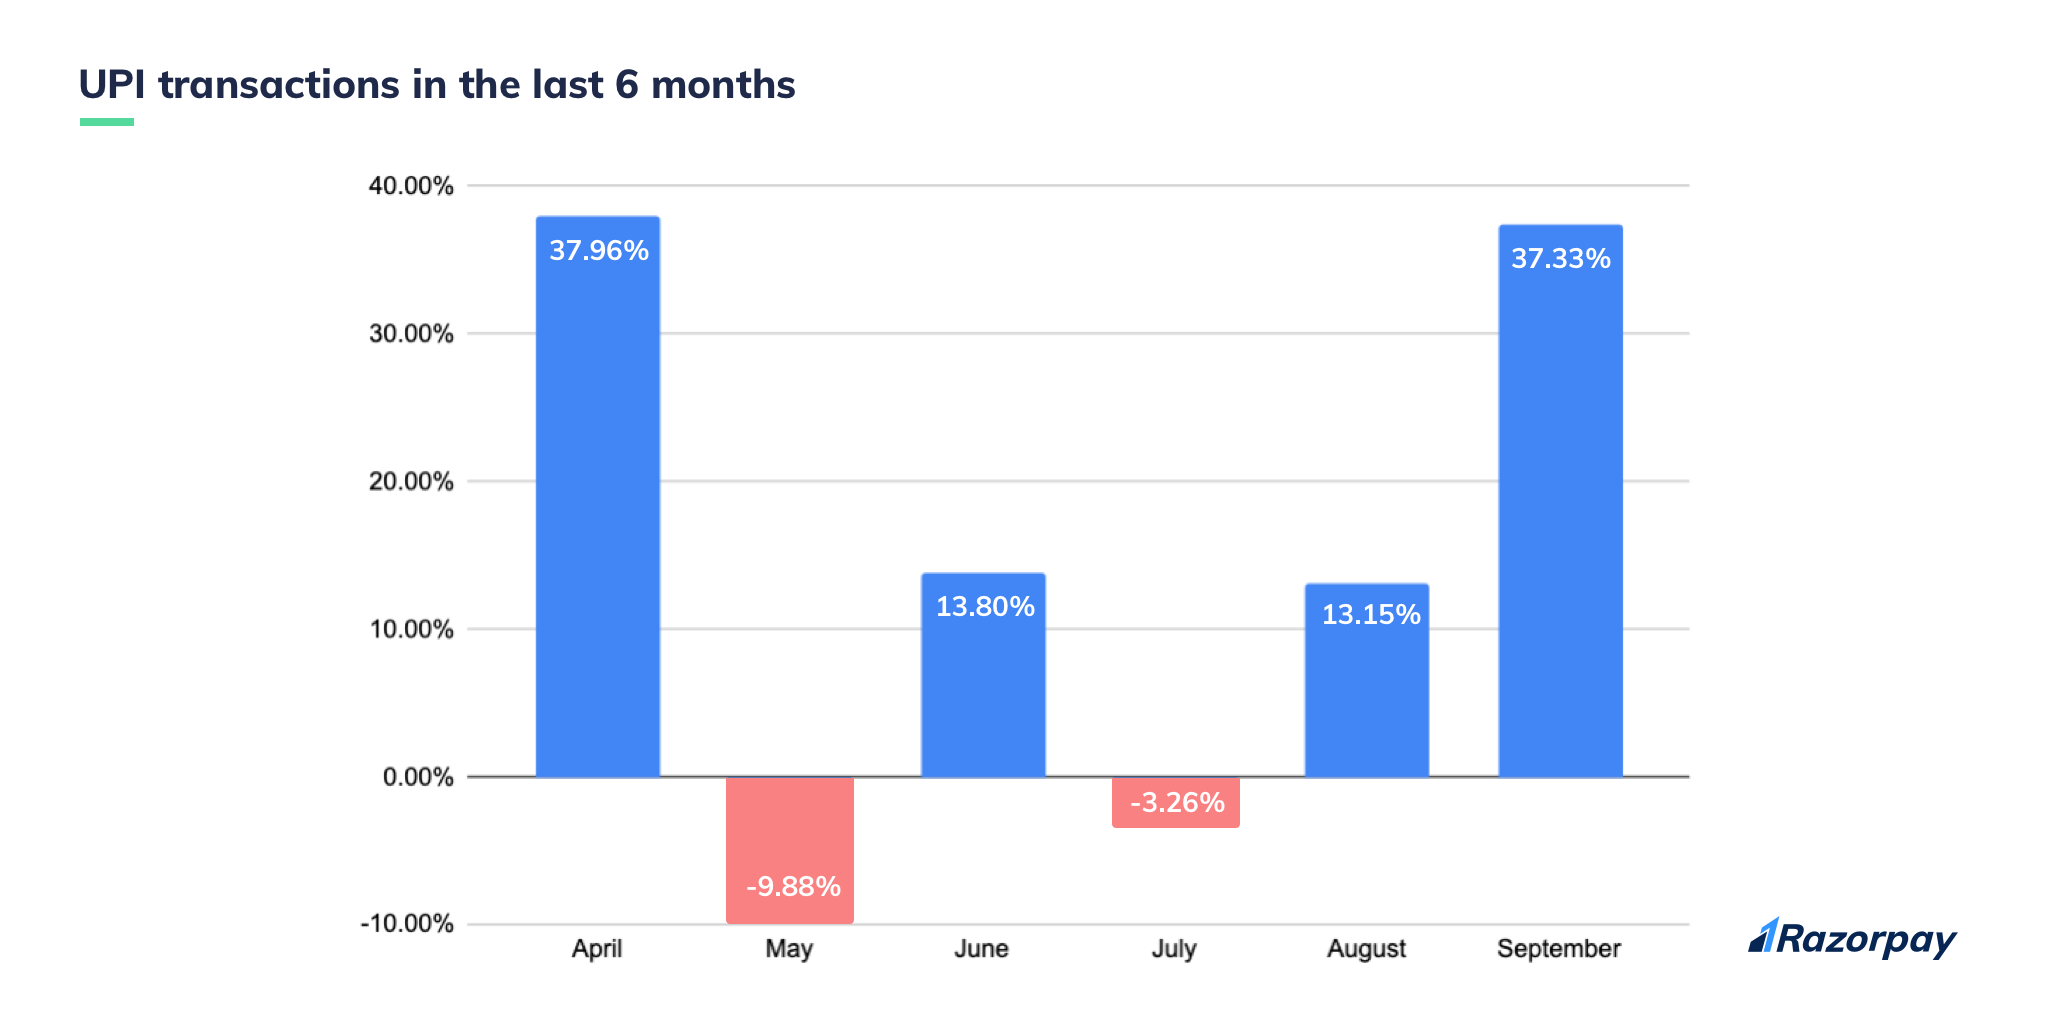
We looked at all UPI transactions from the month of April to September to analyse how much the payment mode has ascended. Keeping the month of April as the base value (calculated upon values of previous months), we can see that there has been sustained growth in the overall transactional value, as well as volume in India.
Although May was an anomaly for various reasons, UPI managed to brush off the dust and swing right in from August, while discovering a new crest in September.
By 37.33%, UPI went through the roof in September, for the first time ever!
Next up, let’s take a look at how some of our favourite UPI apps did in September.
App-Wise Contribution
Since UPI was the biggest player in terms of payment mode, it’s only right we understand how much of a contribution each one of our popular UPI apps bore.
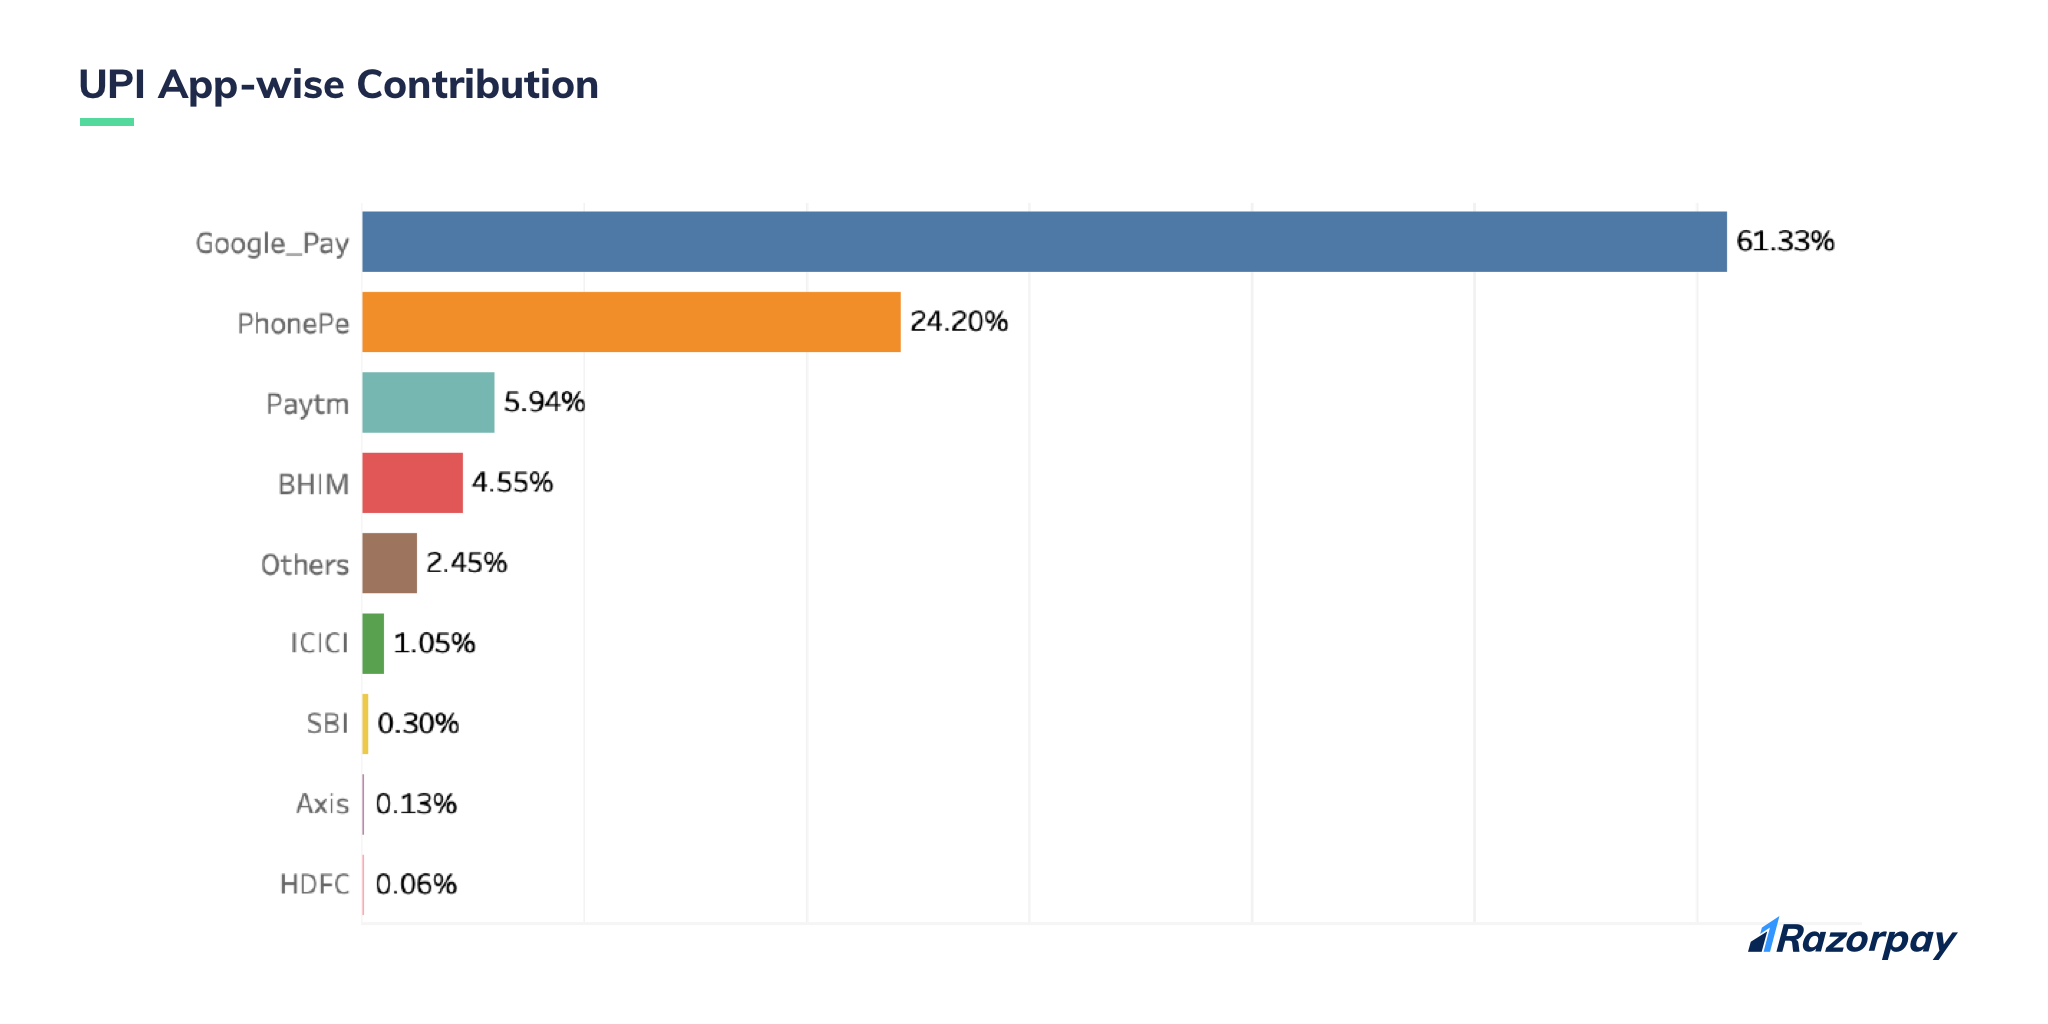

As always, the Google Pay drift continued as the app furnished a hefty 61.33% of the total UPI transactions there were carried out in September. PhonePe too, without changing its spot, followed Google Pay by handing out 24.2%.
Contributions of PayTM (5.94%) and BHIM (4.55%) saw a steady number, around the ballpark of the last few months.
UPI apps of banks (constituting “others”) like Syndicate Pay, Kotak Mahindra, and more, along with Mobikwik, Airtel Payments Bank, Amazon Pay, accounted for a total of 2.45%.
Like UPI, UPI apps have also seen variations in growth. Some of the apps have seen a consistent rise, while others have fallen back in India.
Let’s see what tug-of-war went on in September.
The Evolution Of UPI Apps
We analysed a high value and volume of UPI transactions to determine the growth of each UPI app, and the results were quite satisfying.
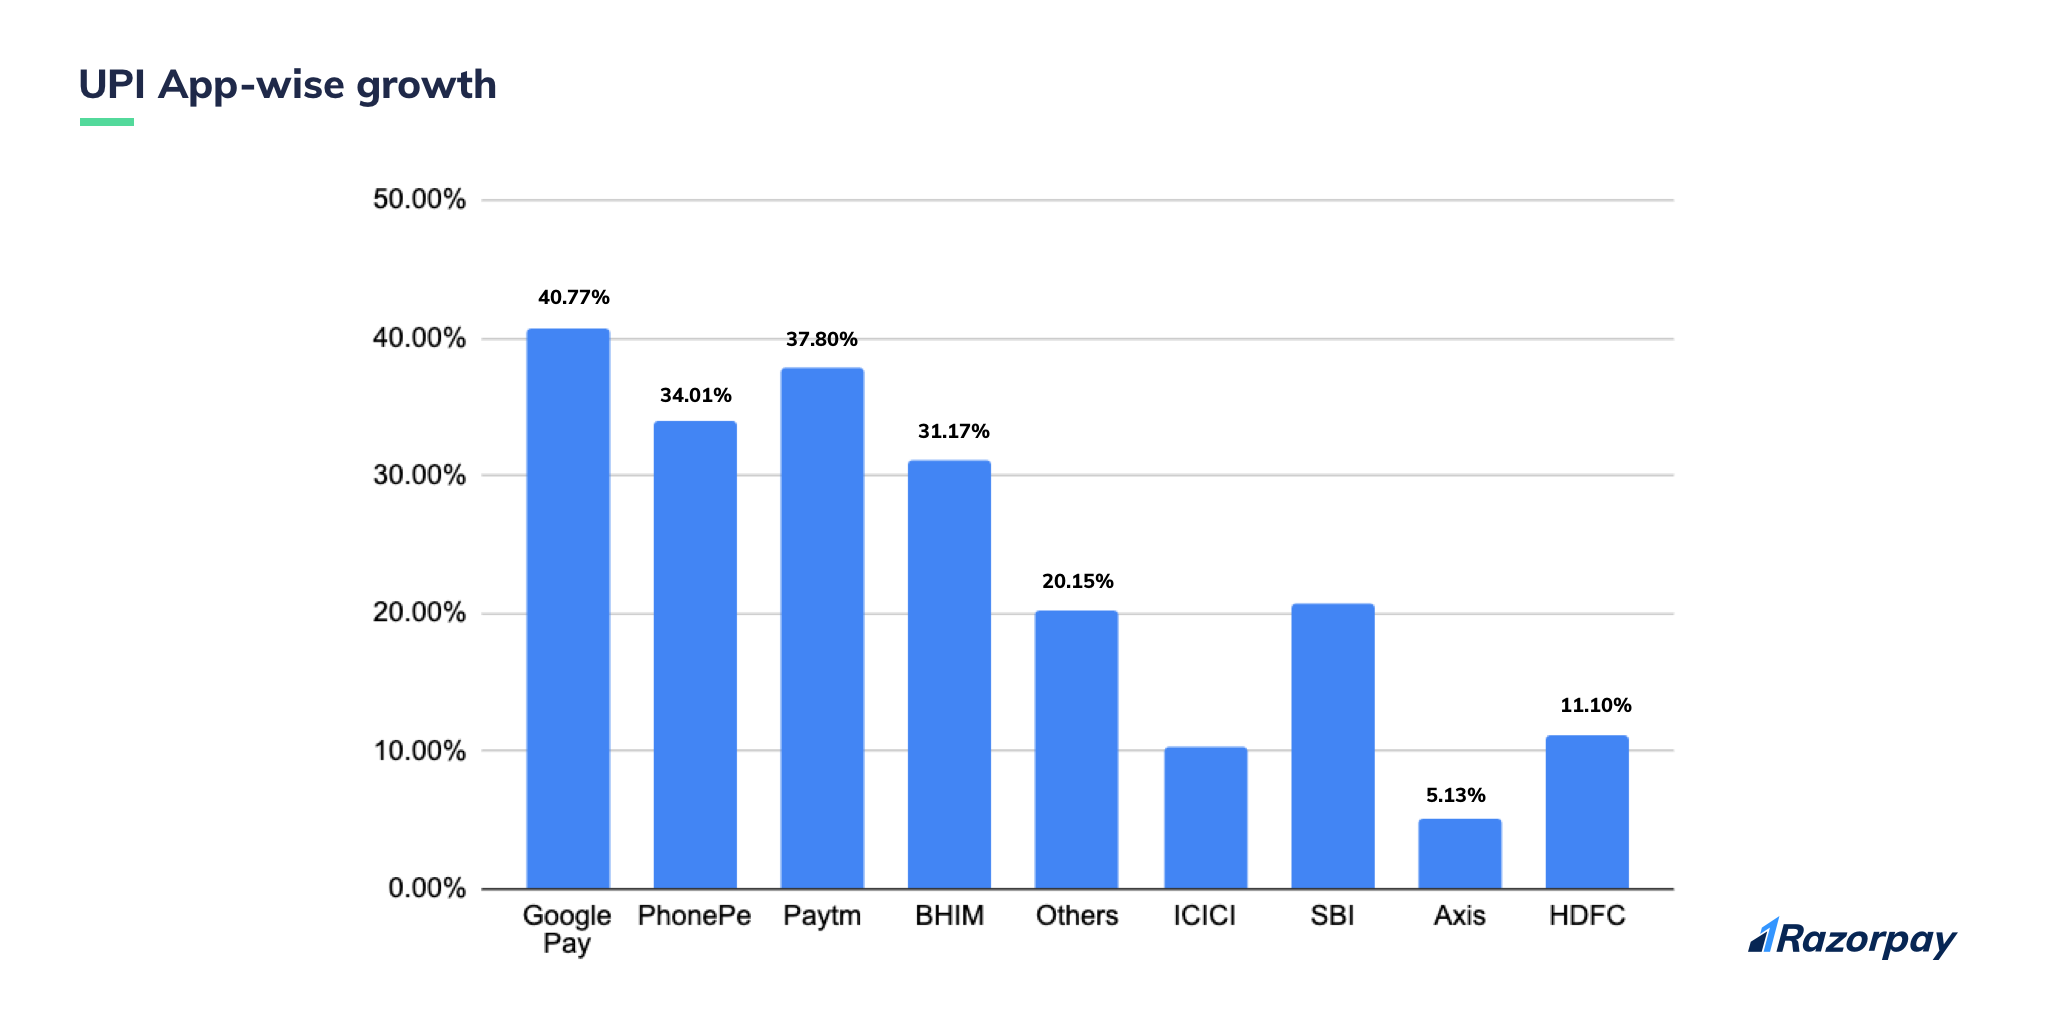
Google Pay, although the most used, adopted app, still saw a massive growth of 40.77%, while PayTM jumped up the ladder from August to 37.8%. And, PhonePe contended to claim its place at 34.01%.
While this war continued, BHIM silently made its way up by 31.17%.
Bank UPI apps like SBI (20.66%), HDFC (11.1%), and ICICI (10.38%) made the list by showing significant growth. Samsung Pay, ICICI Pockets, Mobikwik, WhatsApp Pay, Andhra Bank, and more (grouped as “others)”, also caught up by a total of 20.15%.
UPI transactions from across the country
Now that we’re fully aware of the growth of UPI and UPI apps, let’s dive into some geographical specifications to understand where these transactions came from.
As we’ve worked on the UPI series for a few months now, we had a few predictions about the states and cities’ contributions.
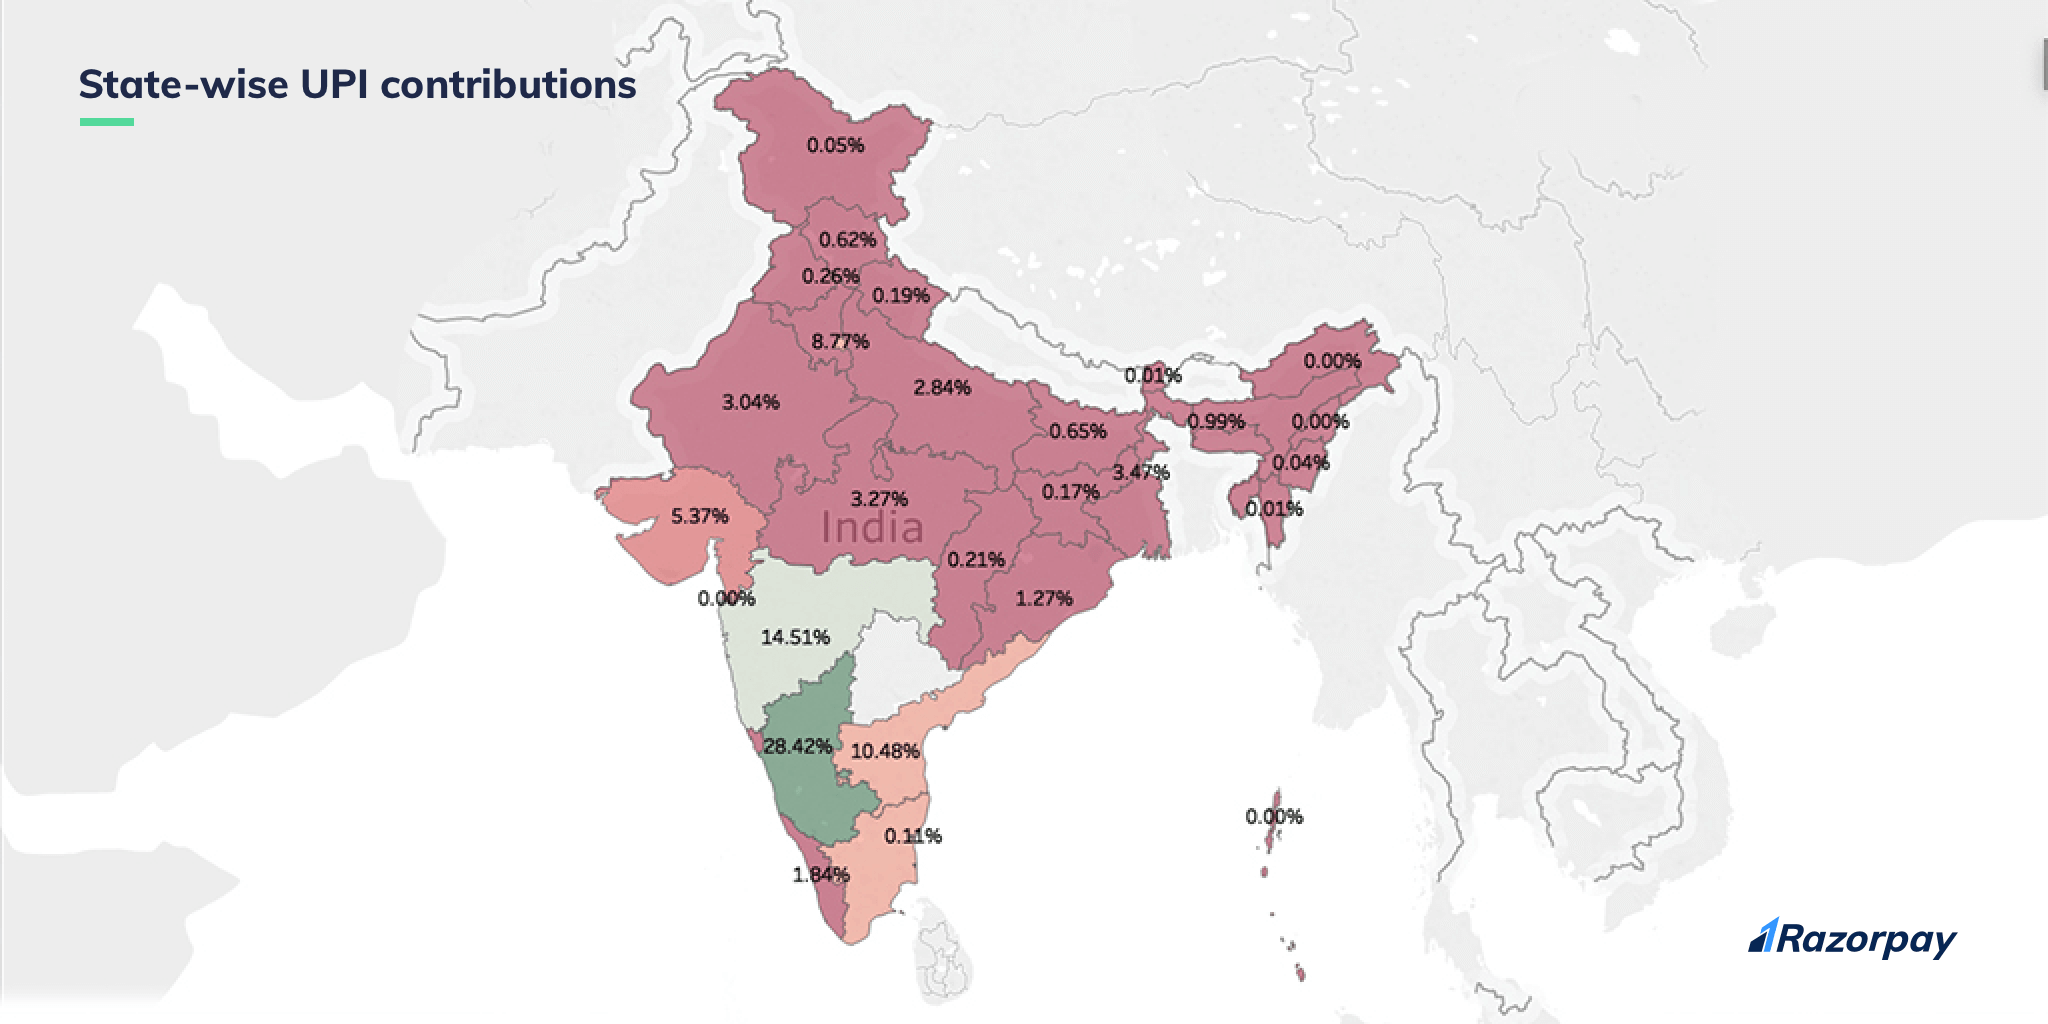
Karnataka, as always, was the #1 contributor of UPI payments in September, as 28.42% of the total UPI transactions were carried out in the state. While so, Maharashtra retained its place just after Karnataka at 14.51%.
Telangana and Andhra Pradesh collectively saw 10.48% of the total UPI transactions, and the NCR region contributed 8.77%.
Now, let’s jump into the contribution of cities.
In our August month’s report, Bengaluru gobbled up the first place, and the same went on in September as the city pitched in 39% of UPI transactions.
Hyderabad also had a significant number of transactions (12.3%) just like Pune (9.4%). Mumbai made its name on the list for the first time at (7.1%) followed by Chennai at (6.1%).
Note: You may wonder how Karnataka’s contribution is 28.42% while Bengaluru is 39%. The reason is, the state split is different from the city split. We consider the whole country to provide a state-wise contribution, whereas we look into 15 cities and calculate their contribution.
While we’re on city-wise contribution, let’s get to the tier wise split in India.
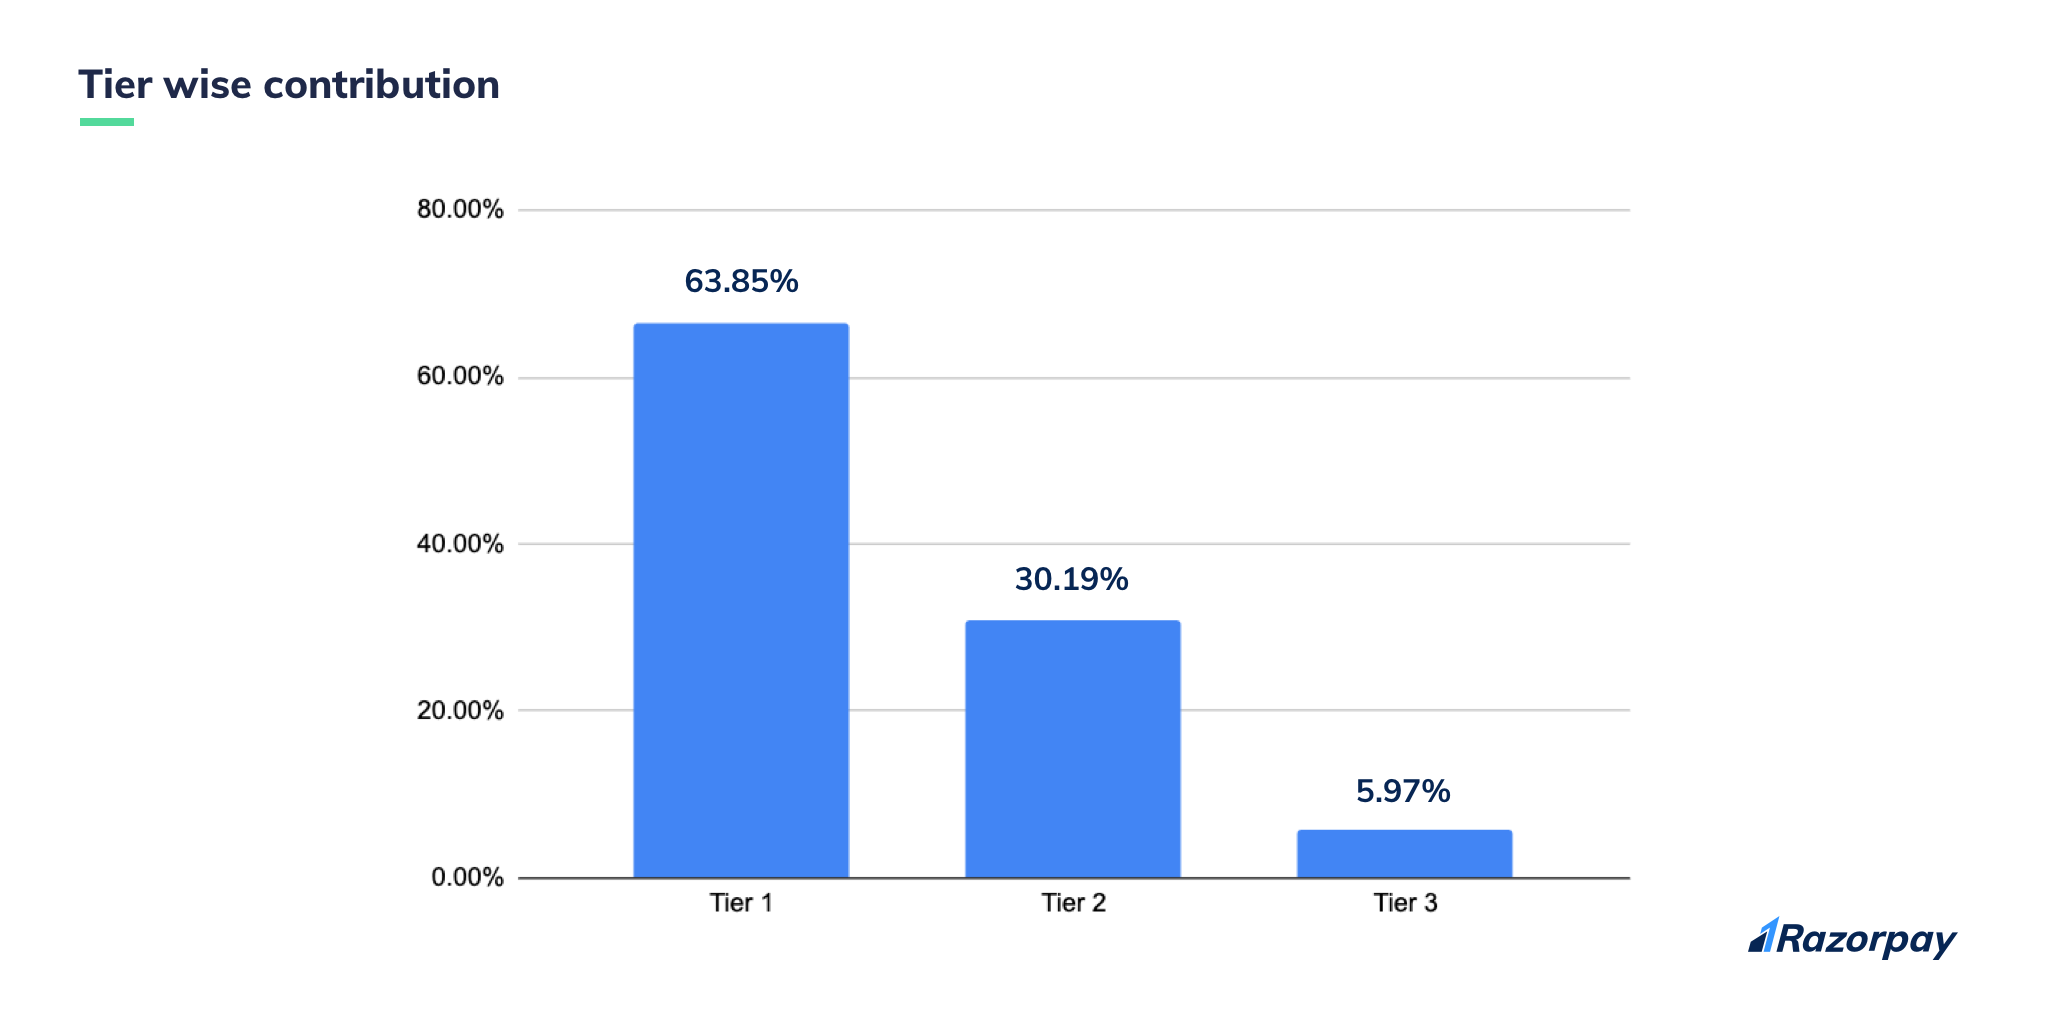
63.85% of UPI transactions were carried out in tier 1 cities, while tier 2 and 3 cities came through with 30.19% and 5.97% respectively.
Ok, that was a lot of numbers and UPI talk.
What’s Next?
We’re as curious as you are!
With UPI disrupting the payments space and climbing to the top as the most preferred payment mode, its impact is only getting bigger and bigger in India.
It’s incredible to see newer innovations making their mark. This is proof that convenience always wins over most other parameters.
Let’s explore more of Indian fintech next month, with another exciting UPI update.
See you then!
(All findings are only based on P2M transactions for UPI alone held on Razorpay platform in September, 2019)