


I am a big fan of Product Hunt and am constantly amazed at its traction. As a curious data guy, I was eager to get my hands on the dataset. After a couple of emails to the founders, I finally got the API access.
Total of 377k votes and 44k comments.
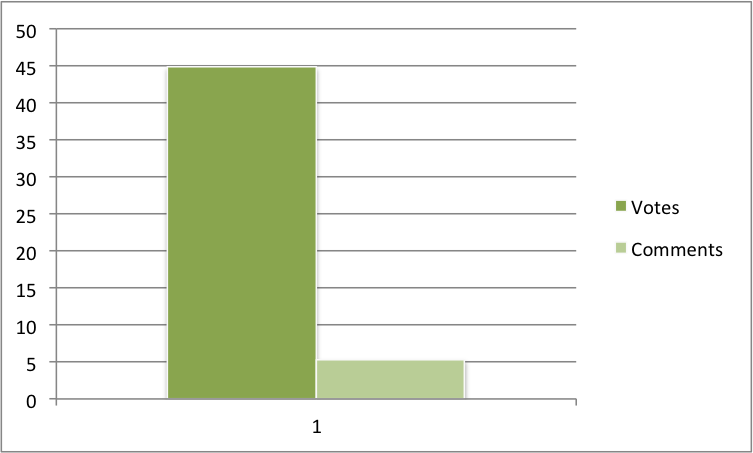
Average number of votes and comments
While votes had a standard deviation of 76.39, comments had a 7.52. This makes sense as the votes range from 0 to 1884 and comments from 0 to 173.
Top Voted Products
- Product Hunt for iOS — 1884 votes, 173 comments
- Inbox by Google — 1291 votes, 128 comments
- Final — 1041 votes, 66 comments
Inspired by Leo Polovets’s post on Coding VC , I tokenized the tagline (removed stop words & punctuations) and then weighted them based on votes.
Most frequent — top 5 (votes in brackets)
app(18129), new(12841), way(11150), iOS(11062), best(9983)
Most frequent adjectives — top 5 (votes in brackets)
new(12841), pre-launch(9005), free(7497), mobile(5393), simple(5302)
Most frequent nouns — top 5 (votes in brackets)
app(17726), way(11150), web(8395), email(7272), design(6479)


Correlations
Time of the day: (all times in pst)
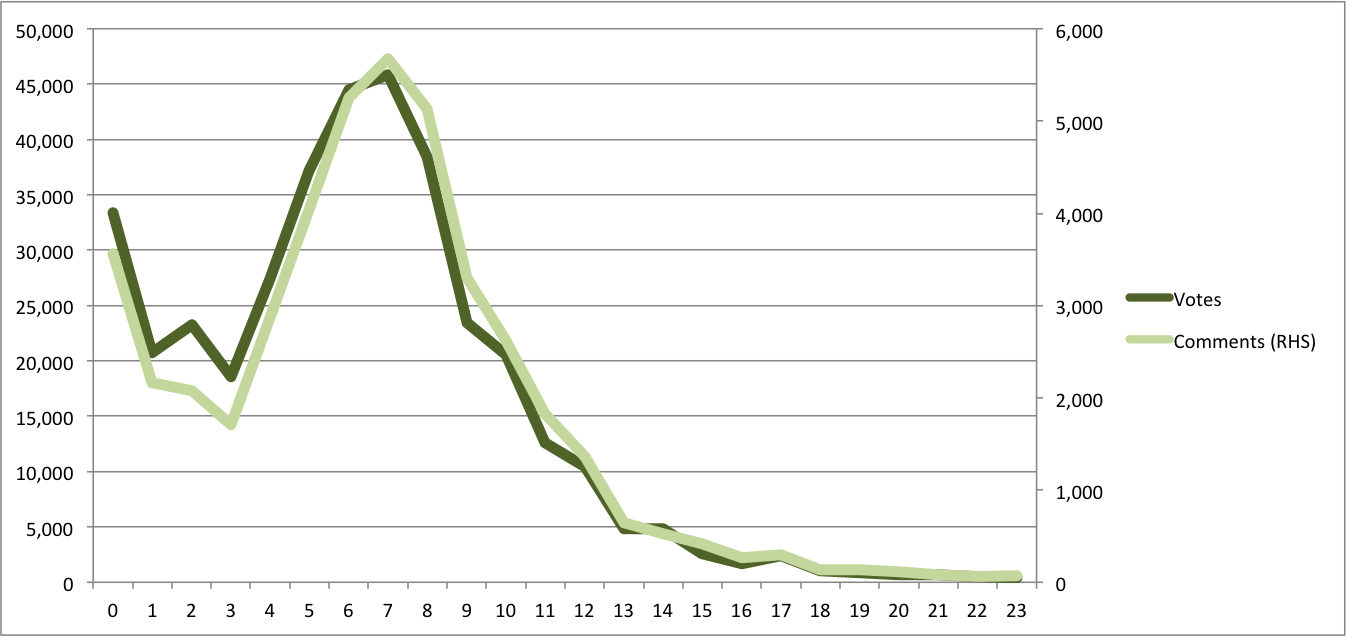
As you can see, 5am — 8am gets the maximum traction with 7am at the peak. As the day goes by the traction decreases. My guess is that if you get in before all other hunts and you are the first thing that people see when you get in — you get an edge. But too early doesn’t work too. I’m guessing the majority of the audience is in the west coast and hence the time makes sense.
Day of the week
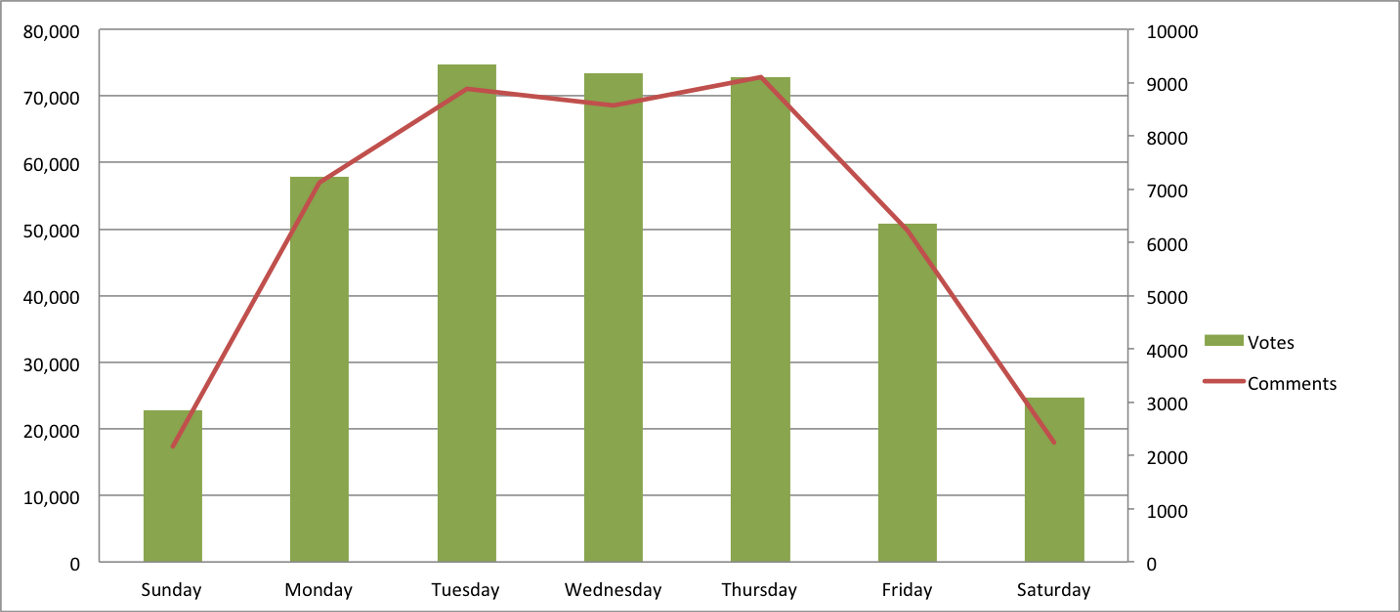
So yeah Tuesday wins but not by a big margin though. Sunday/Saturday being the weekends have the least traction which makes sense. I was discussing this with Eric(@eskuhn) and he says
Monday is all about catch-up, what’s going on this week. Tuesday is when people feel like they have a grip on the week, and are looking to maybe add something new. Wednesday is execution and thur/fri are wrapping up the week.
I ran a PCC correlation between comments and votes — it was 0.68.
In statistics, the Pearson product-moment correlation coefficient is a measure of the linear correlation (dependence) between two variables X and Y, giving a value between +1 and −1 inclusive, where 1 is total positive correlation, 0 is no correlation, and −1 is total negative correlation.
So you would expect this to be near total positive correlation but that doesn’t seem to be the case. Maybe some products just have a long conversation thread and then it becomes an outlier.
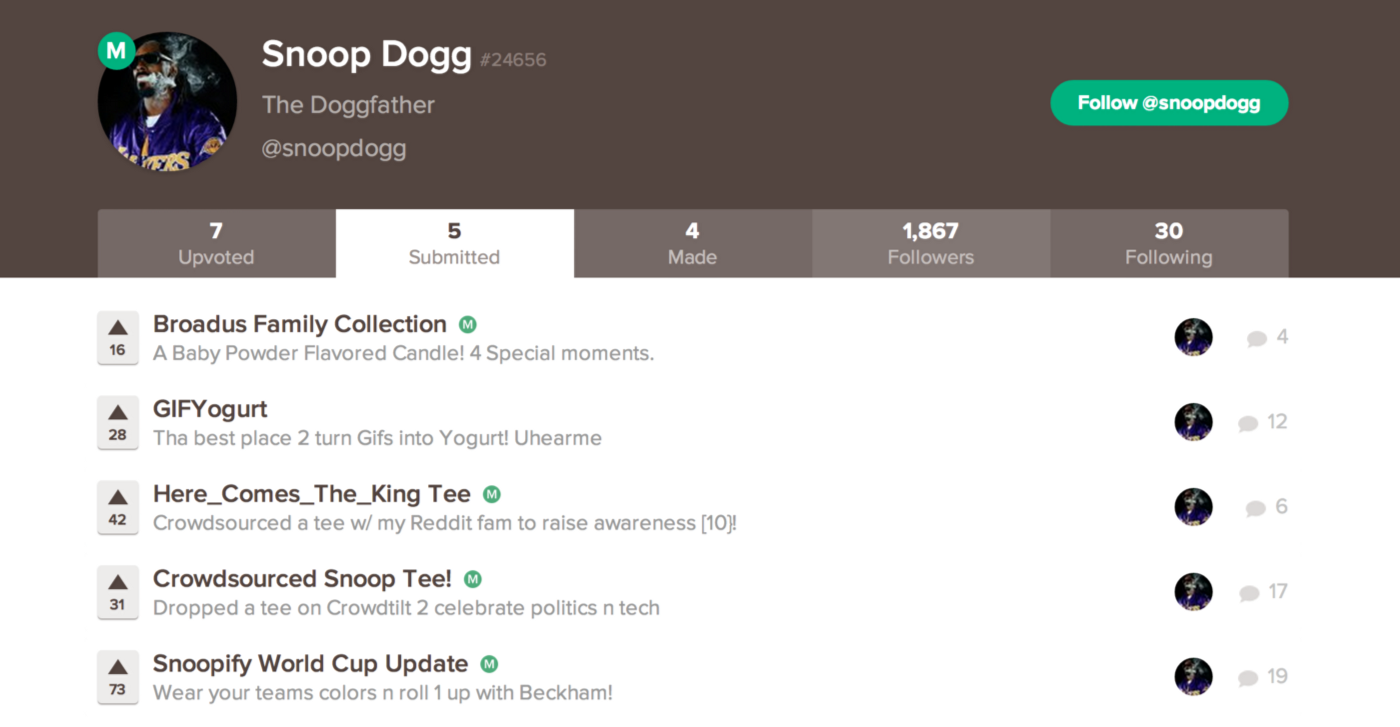
Snoop Dogg’s posts
Surprisingly there is not much of a correlation between twitter followers of the poster with the votes you get. PCC was 0.009. Eg Snoop Dogg has 11.7M followers and has posted 5 products with average number of votes as 48.
Who are the Influencers?
Now the most interesting question — I got all the users who posted more than 50 products and then got the average number of votes their products got. Here are the top 5:
- Eric Willis (@erictwillis) — 105 with 181 posts
- Bram Kanstein (@bramk) — 96 with 94 posts
- Eric Torenberg (@eriktorenberg) — 74 with 77 posts
- Ryan Hoover (@rrhoover) — 64 with 223 posts
- Jonathon Triest (@jtriest) — 59 with 79 posts
So what do you think? Not surprising to see two Product Hunt guys among the top 5.
The top poster is Jack Smith(@jacksmith) with 328 posts and an average of 40. That’s pretty good.
Note: A total of 8417 posts from 11/2013 till date were analyzed.